“You can tell when a student is lost in a classroom. But can you tell when they’re lost online?”
That question has stuck with me ever since I started studying online learning patterns in graduate education. In a traditional classroom, instructors rely on visual cues—blank stares, confused expressions, or raised hands—to gauge whether students are keeping up. But in an asynchronous online course, all we have are… clicks. Scrolls. Logins. Time stamps.
Or so it seems.
What if those digital footprints could tell us more than just when a student logged in or submitted an assignment? What if they could reveal how students actually learn online—who’s struggling silently, who’s just going through the motions, and who’s thriving?
Turns out, they can.
The Hidden Story Inside Every LMS
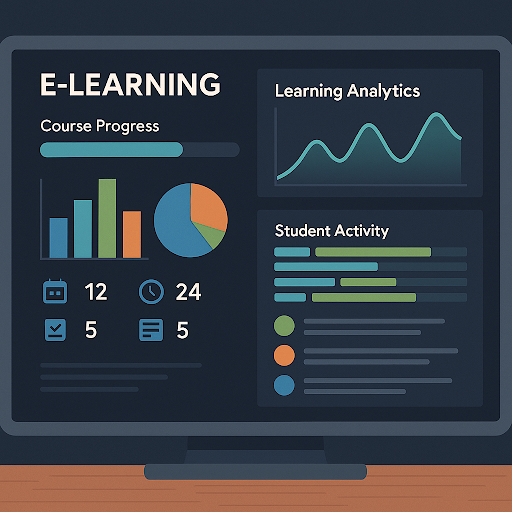
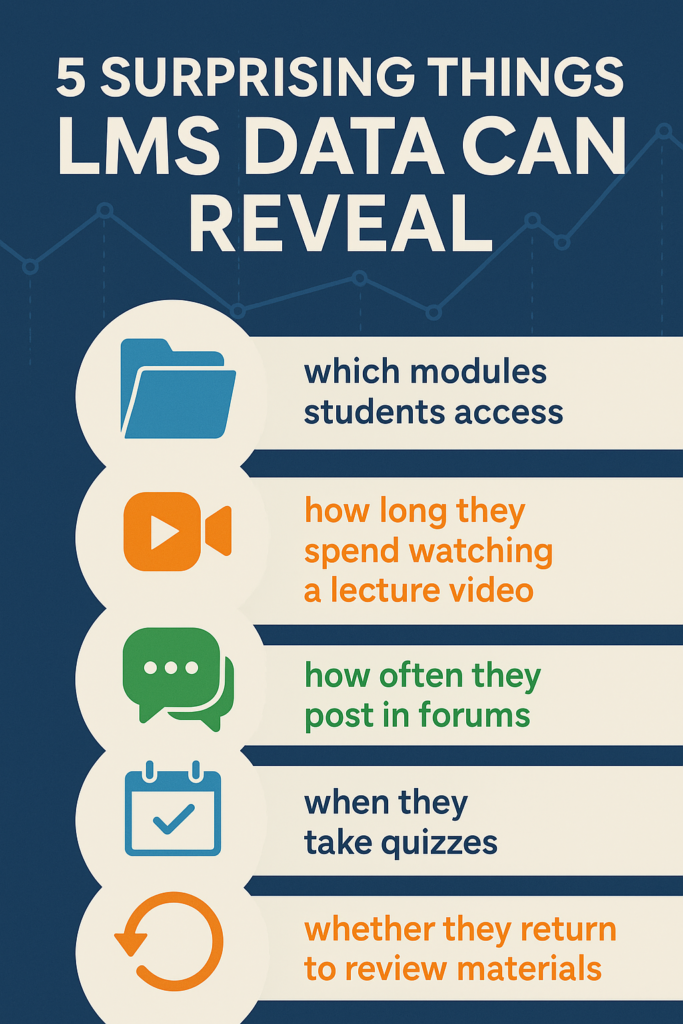
Most institutions utilize Learning Management Systems (LMS) such as Canvas, Blackboard, or Brightspace D2L to deliver online courses. These platforms quietly log thousands of data points: which modules students access, how long they spend watching a lecture video, how often they post in forums, when they take quizzes, and whether they return to review materials. Traditionally, educators look at final grades and student surveys to evaluate a course. But those only show how the course ended, not how the learning unfolded. That’s where behavioral data comes in.
Think of LMS data like the Fitbit of online education. It doesn’t just show the outcome—it shows the journey.
When “Active” Doesn’t Mean “Engaged”
One of the most surprising things we found in our research was that the frequency of activity didn’t always translate to depth of learning. Some students logged in frequently but skimmed through content without completing key activities. Others logged in just a few times per week but spent long, focused sessions reviewing materials and posting detailed discussion responses.
This tells us educators must look beyond surface metrics like login counts and surface metrics like login counts. Instead, we need to interpret patterns—such as whether students revisit content before assessments or engage steadily over time.
In one course, we noticed a significant drop in activity following a major assignment. Upon review, it turned out the feedback was hidden due to a system setting. Once fixed, engagement surged. That small adjustment made a big difference—all because the data pointed us in the right direction.
A Framework for Deep Learning: The Power of Interaction
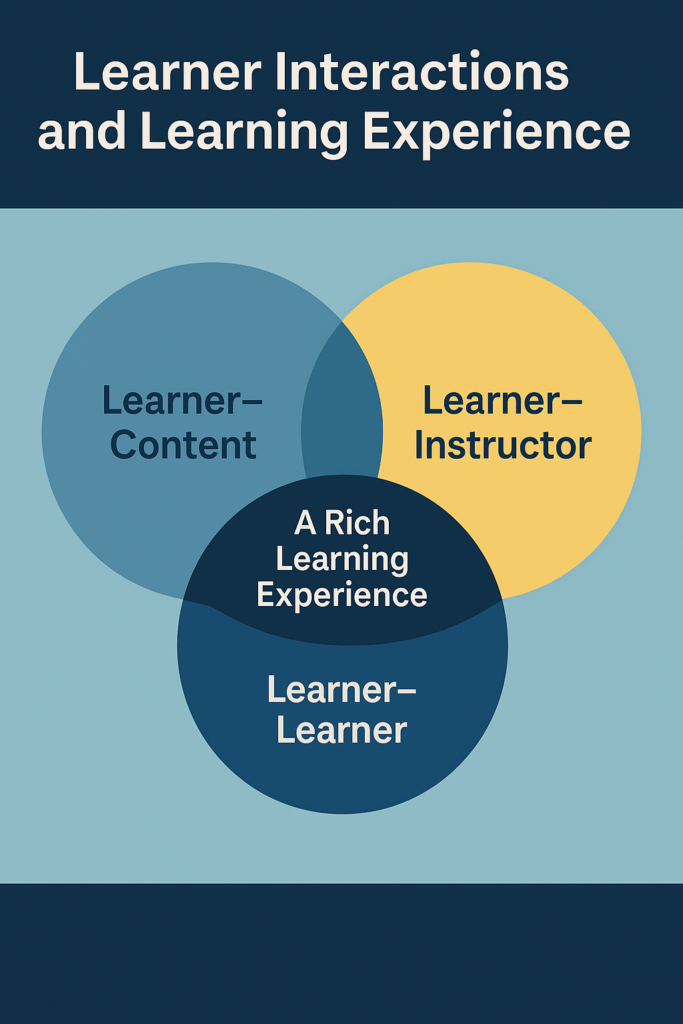
If you peel back the layers of any well-designed online course, you’ll often find three core interaction types. Derived from Moore’s (1989) foundational theory of three types of interaction in distance education , these are the pillars of meaningful online learning:
- Learner–Content Interaction: Students engage with course materials—watching lectures, reading articles, completing assignments. This is where knowledge acquisition begins and cognitive presence is built.
- Learner–Instructor Interaction: Students receive feedback, view announcements, and sense a consistent instructor presence. This interaction fosters motivation, clarification, and a sense of direction in the learning journey.
- Learner–Learner Interaction: Students participate in discussion boards, peer feedback, and collaborative projects. Through dialogue and debate, they construct meaning socially and deepen understanding.
These three types of interaction collectively strive to replicate, as closely as possible, the most effective and high-quality elements of traditional face-to-face education—namely, direct instruction, peer collaboration, and immersive engagement with learning materials. While the medium is different, the underlying pedagogical intent remains the same: to create a rich, dynamic, and human-centered learning experience.
Moore argued that the balance and richness of these interactions determine the depth and effectiveness of distance education. In modern online learning environments, these principles remain essential, but today, we can measure them with precision using LMS data. How often a student revisits content, engages in forums, or views instructor feedback can all serve as indicators of how well a course supports these interaction types.
Each type addresses a different element of the learning experience—cognitive, instructional, and social. But when combined effectively, they form the foundation of what we call a rich learning experience.
Course Design Starts with Understanding Behavior
Once instructors begin to see how students actually move through their courses, they can redesign with intention. Here are just a few design shifts guided by LMS insights:
- Break up long videos into shorter segments when drop-off rates spike at the midpoint.
- Move discussion deadlines earlier in the week if most logins happen on Mondays and Thursdays.
- Use short video announcements to boost re-engagement after dips in activity.
One instructor redesigned their online leadership course after realizing students were skipping long readings but regularly watched even optional videos. By converting reading summaries into short video explainers, both participation and quiz scores improved.
Spotting Struggles Before It’s Too Late
Data also helps instructors identify struggling students before they fall behind.
If a student consistently avoids certain modules, never replies in forums, or submits work last-minute without review, it could signal deeper challenges. With that awareness, instructors can proactively check in and offer support.
Some institutions use early-alert dashboards to flag under-engaged learners. But even without complex tools, reviewing basic interaction patterns weekly can make a difference.
Looking Ahead: Smarter, More Human Online Learning
We’re only scratching the surface of what LMS data can reveal. But the future is full of promise. Imagine a platform that adapts to each learner—offering micro-reviews when students pause too long on a concept, or suggesting peer connections based on shared learning paths. AI-enhanced course experiences are already in motion.
Yet, even the smartest algorithms can’t replace a timely message from an instructor that says, “I see you haven’t logged in—everything okay?”
Because at the end of the day, online learning isn’t just about technology—it’s about connection.
Final Thoughts
LMS data is more than digital exhaust. It’s a rich source of insight—if we know where to look.
By analyzing how students interact with content, instructors, and peers, we can design smarter courses, catch struggles early, and create learning environments that feel not just online, but alive.
And that’s what the best online education is really about—not just moving information, but moving people.
Reference
Moore, M. G. (1989). Three types of interaction. The American Journal of Distance Education, 3(2), 1–6. https://doi.org/10.1080/08923648909526659
Mohamad Baba is an experienced instructional designer and Ph.D. candidate with over 20 years of expertise in online learning, curriculum development, and educational technology. His work focuses on leveraging data-driven strategies to enhance learner engagement and course effectiveness in higher education. Passionate about innovation, he specializes in LMS analytics, competency-based education, and faculty development.