In the October 2025 OLC Snap Survey, participants raised an increasingly common question: What are the ethical implications of Generative AI (GenAI)’s environmental impact? As both a regular user of these tools and a researcher who cares deeply about sustainability, I wanted to understand what the evidence actually shows. The conversation has spread so quickly that it is now full of sweeping claims—and plenty of misconceptions.
The good news: we finally have real, production-scale measurements of AI’s energy, carbon, and water use—based on how systems actually behave in the wild, not laboratory speculation. These data finally allow us to compare a prompt’s footprint to everyday actions like charging a phone, streaming a video, or commuting to work. As several recent reviews note, AI’s role in sustainability is complex: while it demands significant computational resources supported by large data centers, it also enables more efficient energy systems overall (Adewoyin et al., 2025).
This post summarizes what the latest 2025 research tells us about the real energy, carbon, and water footprint of using modern GenAI tools—and how those impacts compare to familiar daily activities.
The results may surprise you.
What Else Data Centers Support (Beyond GenAI)
It’s important to remember that GenAI is only one of many activities powered by data centers. The same facilities that serve AI models also handle video streaming, cloud storage, email, e-commerce, banking, logistics, navigation apps, electronic health records, social media, learning management systems (LMSs), videoconferencing, and everyday smartphone syncing and backups. Every Netflix episode, Amazon purchase, Canvas upload, Google Doc save, or Zoom meeting touches the same global infrastructure that processes an AI prompt. In other words, the environmental footprint we often attribute to “AI” is really part of a much broader ecosystem of digital activity—much of which we rely on daily. Understanding GenAI’s footprint therefore means placing it in context, not isolating it from the rest of the digital services that share the same pipes, servers, and cooling systems.
What a Modern AI Prompt Costs
A new Google study measured the full stack of AI serving for the Gemini assistant in production—covering accelerator power, host systems, idle capacity, and datacenter overhead. In simple terms, the team measured everything involved in delivering an AI answer, including the chips that do the math, the servers that coordinate those chips, and the data center infrastructure that powers and cools them.
Bottom line:
After major efficiency and clean-energy gains over the past year, the median Gemini text prompt consumed about:
- 0.24 Wh (0.00024 kWh) of energy
- 0.26 mL of water
This reflects major improvements: Google reports a 33× reduction in energy and 44× reduction in carbon for the median prompt compared with 2024 (Elsworth et al., 2025).
That means:
- The energy use is comparable to watching ~nine seconds of TV.
- The water use is roughly five drops.
While Gemini’s serving footprint is extremely low in Google’s optimized deployment, footprints do vary widely across providers.
What This Is (and Isn’t)
- These measurements reflect serving (inference), not training. These numbers represent the energy used when the AI responds to users, not the separate, one-time process of training a model. Training very large models still has meaningful footprints—Li et al. (2023) estimated ~700,000 liters of cooling water for a single GPT-3-scale training run.
- These measurements reflect an optimized, clean-energy deployment. Footprints vary by provider, region, cooling system, and model size.
- The range can be wide. A 2025 benchmark across 30 models found that some long, complex prompts exceeded 33 Wh per query, while short, efficient ones used ~0.4 Wh (Jegham et al., 2025).
How a Prompt Compares to Daily Tech Use
It’s hard to interpret 0.24 Wh without a baseline. Here’s how a single AI prompt stacks up.
Phone Charging
- Smartphone battery: 12–17 Wh (Gallagher, 2022)
- One AI prompt (0.24 Wh) = 1–2% of one phone charge
- About 50–70 prompts per full charge
- Annual phone use: ~31 kWh → ~7 kg CO₂ (Bryce, 2024)
Takeaway: a prompt’s energy use is a tiny fraction of routine phone use.
Laptop Use
- Active laptops draw 30–70 Wh per hour (Marsh, 2024).
- A prompt at 0.24 Wh equals 0.3–0.8% of one hour of laptop time.
Takeaway: the energy you burn typing the prompt far exceeds the energy to answer it.
Video Streaming
- HD streaming: 36 g CO₂ per hour (Kamiya, 2020)
- One prompt emits fractions of a gram under clean power
Takeaway: a few seconds of streaming outweigh a prompt.
Commuting by Car
- Gasoline car: 400 g CO₂ per mile (EPA, 2023)
- 15-mile round trip: ~6 kg CO₂
Takeaway: You’d need tens of millions of prompts to equal one short commute. Transportation continues to dominate most individuals’ carbon footprints.
These comparisons matter: datacenters power far more than GenAI. Every online search, LMS login, Zoom call, email, Amazon purchase, cloud file sync, and video stream uses the same shared infrastructure.
Water Use: Closed Loops, WUE, and Why Ranges Matter
As Yañez-Barnuevo (2025) highlights, the water footprint of data centers extends well beyond the server room: in some cases up to 5 million gallons per day — the equivalent of a small town’s daily use. And water use is shaped by geographic and infrastructural factors: arid climates, high chip-densities, and evaporative cooling towers all raise the figure. Closed-loop cooling and non-potable sources offer mitigation paths.
Water use in datacenters varies with design and climate.
- Closed-loop liquid cooling recirculates water and uses very little.
- Evaporative cooling requires steady replenishment of “make-up water,” consuming much more.
The industry measures this with Water Usage Effectiveness (WUE)—liters of water used per kWh of computing energy:
- Typical average: ~1.9 L/kWh (Tozzi, 2025; Yañez-Barnuevo, 2025)
Using a simple assumption of 1 L/kWh, a 0.24 Wh prompt uses roughly 0.24 mL of water, closely matching Google’s measured 0.26 mL.
Broader Context
Li et al. (2023) project global AI water withdrawals could reach 4.2–6.6 billion m³ by 2027 without efficiency gains and strategic siting.
And this demand doesn’t exist in isolation. Many regions already experience significant pressure from other high-water-use activities. For example:
- A single almond can require 12–14 liters of water to grow.
- One avocado may require around 60 liters.
Takeaway: In water-stressed regions, additional data center load can meaningfully compound local stress.
This is why where and when models run matters. Data centers in arid regions or during peak-demand seasons can have disproportionately higher impacts.
Is AI “Good” or “Bad” for the Environment?
Neither—at least not by default.
In 2025, per-prompt serving can be tiny, especially when operators:
- right-size models
- streamline software
- procure clean energy
Google’s one-year reductions (33× energy, 44× carbon) show that rapid progress is possible (Elsworth et al., 2025).
Yet scale still matters. Billions of daily prompts, plus training, hardware manufacturing, and end-of-life processes, all add up. Adewoyin et al. (2025) point out that AI often increases short-term energy demand even as it yields long-term efficiencies in grid optimization, forecasting, and renewable integration.
AI can reduce environmental impact by:
- lowering travel through remote collaboration,
- reducing printing and material waste,
- optimizing supply chains and logistics,
- and enabling energy and water management systems.
The IEA notes that while AI contributes to rising datacenter demand, total global electricity use from datacenters remains a few percent of global consumption. Whether this stabilizes or grows depends on policy, efficiency, and design choices.
Practical Takeaways for Institutions and Educators
1. Use measured numbers.
- Gemini-class services: ~0.24 Wh and 0.26 mL per prompt.
- On-prem or larger models can be 10–100× higher. (“On-prem” refers to on-premises computing—running AI on servers your institution owns and maintains locally, which are typically less energy- and water-efficient than hyperscale cloud datacenters.)
2. Use relatable analogies.
- One phone charge = 50–70 prompts
- One hour of laptop use = 125–300 prompts
- One hour of HD streaming ≫ a prompt
- One 15-mile commute = millions of prompts’ worth of CO₂
3. Track water, not just energy.
- Ask vendors for WUE.
- Favor low-water cooling in low-stress regions.
4. Avoid apples-to-oranges comparisons.
- Training ≠ serving.
- On-device ≠ multimodal cloud inference. On-device AI (running on your phone or laptop) has a fundamentally different—and far smaller—environmental footprint than multimodal cloud inference, which relies on large datacenter models and cooling systems.
5. Design for sufficiency.
- Right-size models.
- Keep prompts concise.
- Batch heavy workloads. Small choices compound rapidly at institutional scale.
Small design choices compound quickly at institutional scale. Your IT department can help you make the right decisions for your institution or organization while considering all the environmental aspects of a given tool.
The Bottom Line
As of late 2025, a median AI prompt in a best-in-class cloud environment has a tiny footprint—far smaller than common digital habits like streaming or charging a phone, and minuscule compared with a short car commute. Even one cup of coffee (≈140+ L of water) or a quarter-pound burger (≈1,500–3,000 L) dwarfs the water associated with a prompt. AI prompts are, quite literally, a drop in the metaphorical water bucket of human impact.
But trillions of prompts per year, plus model training and hardware life cycles, mean that AI’s footprint is not negligible. Datacenters already account for 4.4% of U.S. electricity use, potentially rising to 12% by 2028 (Zhao, 2025). Several leaderboards now track AI Energy Scores (AI Energy Score; ML.ENERGY) so users can choose more efficient options.
It is important to remember that the lion’s share of environmental impact comes from data centers in this context. From Amazon shopping and LMS usage to streaming and cloud storage, data centers already support an enormous portion of modern life. AI adds to that load, but it is one part of a much larger digital ecosystem.
The way forward is measurement, transparency, efficiency, and using AI where it truly displaces higher-footprint activities—not where it adds unnecessary load.
References
Adewoyin, M. A., Adediwin, O., & Audu, A. J. (2025). Artificial intelligence and sustainable energy development: A review of applications, challenges, and future directions. International Journal of Multidisciplinary Research and Growth Evaluation, 6(2), 196-203. https://doi.org/10.54660/.IJMRGE.2025.6.2.196-203
Anderson, K. (2025, February 13).The Carbon Cost of Streaming. Greenly. https://greenly.earth/en-us/leaf-media/data-stories/the-carbon-cost-of-streaming
Bryce, E. (2024, October 3). The Total Energy Consumption of a Mobile Phone User in One Year. Bryce Energy Services. https://www.bryceenergyservices.com/2024/10/03/the-total-energy-consumption-of-a-mobile-phone/
Elsworth, C., Huang, K., Patterson, D., Schneider, I., Sedivy, R., Goodman, S., Townsend, B., Ranganathan, P., Dean, J., Vahdat, A., Gomes, B., & Manyika, J. (2025). Measuring the environmental impact of delivering AI at Google scale. arXiv. https://arxiv.org/abs/2508.15734
Gallagher, S. (2022, September 12). Apple’s iPhone 14 battery capacities revealed in filing. Apple Insider. https://appleinsider.com/articles/22/09/12/apples-iphone-14-battery-capacities-revealed-in-filing?utm_source=chatgpt.com
Istrate, M., Roman, L., & López, S. (2024). The sustainability footprint of digital services: Quantifying environmental impacts of online consumption. Nature Sustainability, 7(3), 451–462. https://www.nature.com/articles/s41467-024-47621-w
Jegham, N., Zouari, A., & Abid, M. (2025). How hungry is AI? Benchmarking the energy, water, and carbon footprints of AI models. arXiv. https://arxiv.org/abs/2505.09598
Kamiya, G. (2020, December 10). The carbon footprint of streaming video: fact-checking the headlines. International Energy Agency. https://www.iea.org/commentaries/the-carbon-footprint-of-streaming-video-fact-checking-the-headlines
Li, P., Yang, J., Islam, M. A., & Ren, S. (2023). Making AI less “thirsty”: Uncovering and addressing the secret water footprint of AI models. arXiv. https://arxiv.org/abs/2304.03271
Marsh, T. (2024, November 22). Average laptop power consumption report: Energy draw and battery efficiency data 2024. Energy Sage. https://www.energysage.com/electricity/house-watts/how-many-watts-does-a-computer-use/
Tozzi, C. (2025, January 17). Data center water usage effectiveness (WUE) and cooling optimization: 2025 update. Data Center Knowledge. https://www.datacenterknowledge.com/cooling/a-guide-to-data-center-water-usage-effectiveness-wue-and-best-practices
United States Environmental Protection Agency (EPA). (2023, December 1). Greenhouse gas emissions from a typical passenger vehicle. U.S. Environmental Protection Agency. https://www.epa.gov/greenvehicles/greenhouse-gas-emissions-typical-passenger-vehicle
Yañez-Barnuevo, M. (2025, June 25). Data Centers and Water Consumption. Environmental and Energy Study Institute. https://www.eesi.org/articles/view/data-centers-and-water-consumption
Zhao, C. (2025, July 2). How much energy does your AI prompt use? It depends. Science News. https://www.sciencenews.org/article/ai-energy-carbon-emissions-chatgpt
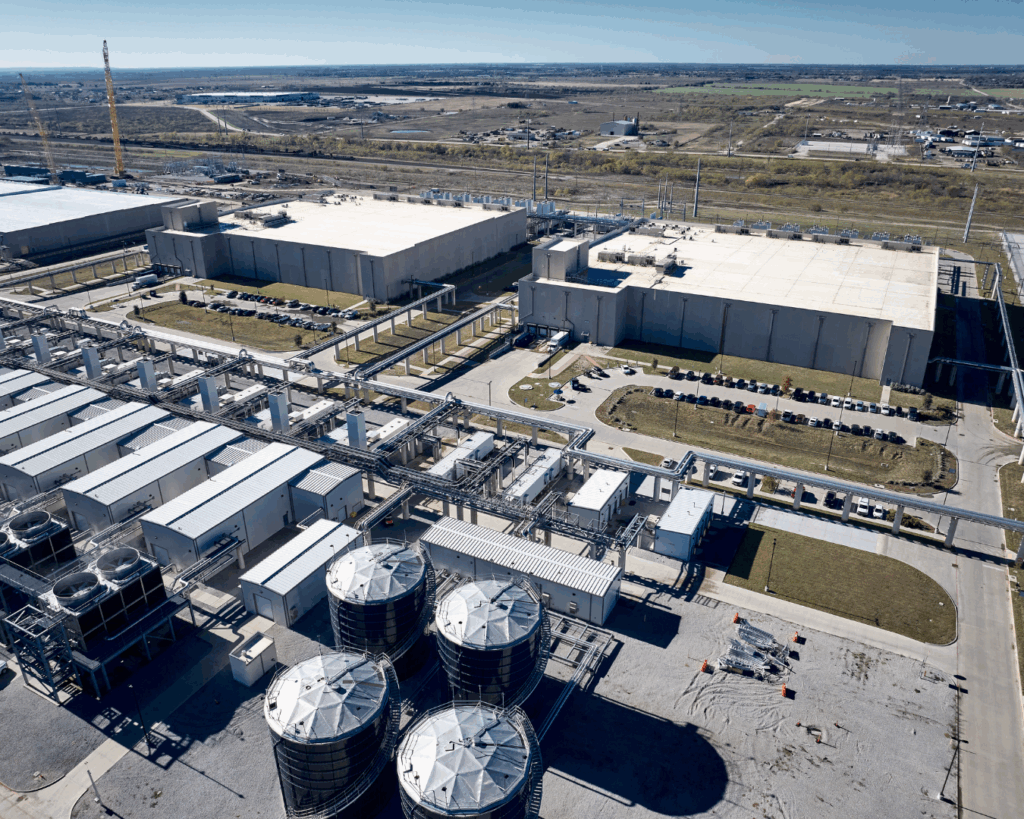
Cover image: Google, datacenters.google
 As senior researcher at OLC, Carrie designs, conducts and manages the portfolio of research projects that align with the mission, vision, and goals of the Online Learning Consortium. She brings with her over 15 years of experience as an online educator and instructional designer with a passion for research. She has peer-reviewed publications covering a variety of topics such as open educational resources, online course best practices, and game-based learning. In addition to a strong background in higher education teaching and instructional design, Carrie brings with her extensive experience in customer service and small business management. She holds a PhD in Educational Technology from Arizona State University, an MS in French from Minnesota State University, and BA in French from Arizona State University.